In overcoming problems that often arise in Jakarta, the
Government of Jakarta always tries to make the right decisions or
policies, which was achieved through careful consideration and provided
by data and facts obtained from various points of view. It was no
exception when Jakarta was affected by the spread of the COVID-19
(Coronavirus Disease 2019) pandemic. In response, one of the first steps
taken by the government was to create the official corona.jakarta.go.id
website which is now a trusted source of information for the public and
the media in the capital.

With the ongoing development of the case, the government's
corona site continues to go through updates with several new features.
Smartcitizen, this time we will discuss the latest menu called Data
Visualization, which contains various dashboards or additional
visualizations to support COVID-19 main data from the Health Office of
Jakarta. Let's find out the function or usability and what kind of data
you can see in it.
Public Mobility Monitoring

The government collaborated with the startup company
Nodeflux in taking advantage of artificial intelligence technology to
monitor citizen movements during the implementation of the Large-Scale
Social Restrictions (PSBB). Monitoring data was taken through image
capture between 06.00-22.00 WIB from around 1,500 CCTV cameras spread
across 44 districts. Results or sampling from CCTV monitoring conducted
in a certain period of time then processed to display a variety of data,
ranging from vehicle density to the distribution of people at certain
hours.
List of data you can see in this dashboard:
-
Vehicle density during COVID-19
-
Distribution of vehicle density per hour
-
Comparison of vehicle density in the last 3 days
-
Distribution of the density of people at every hour
-
Comparison of the density of people in the last 3 days
-
Map of the density profile
-
Map of CCTV locations
Mudik Movement Anticipation
The tradition of returning to hometown or 'mudik' (annual
exodus) usually becomes a special moment during Lebaran. Unfortunately,
the coronavirus outbreak that spreads, not only in Jakarta but also in
several other cities in Indonesia, made the government urging the public
not to do homecoming this year. Even so, the DKI Jakarta Provincial
Government is still making preparations by utilizing a number of
historical data as an anticipatory step for the homecoming movement that
will occur in and from Jakarta.
List of data you can see in this dashboard:
-
Jakarta mobility figures
-
Number of travelers (2018-2019)
-
Mudik and counter-mudik figures (2015)
-
Movement of people from Jakarta (2018)
-
Number of vehicles (2014-2016)
Impact of COVID-19 on Traffic Congestion
In order to reduce the spread of the COVID-19 pandemic, the
government is trying to reduce the movement of citizens by suspending
school and office activities. Overall, the level of congestion in
Jakarta showed a decline after the policy. This can be seen from the
continued increase in the average speed of vehicles recorded since
February 16. You can also see a comparison of average speeds on several
road sections before and after a certain period, such as the
announcement of the first positive case and the WFH (Work From Home) and
PSBB policies.
List of data you can see in this dashboard:
-
The average speed of the vehicle based on the road
-
The average speed of the vehicle based on time
-
Average vehicle speed by period
Community Complaints Related to COVID-19

Smartcitizen, do you know, even though Jakarta is currently
hit by a COVID-19 pandemic, the government is still working on
following up on reports from the public? Yes, by visiting this
dashboard, we can monitor trends and reporting status related to the
spread of coronavirus outbreaks. In addition, you can also see five
categories with the highest number of reports during the COVID-19
period: disturbance of peace and order, social assistance,
employee-employer relations, violations of regional regulations, and
health data collection. So you don't need to worry. If you encounter
problems regarding COVID-19, just report through 13 complaint channels
that are integrated into the Cepat Respon Masyarakat (CRM) system.
List of data you can see in this dashboard:
-
Daily report trends per day
-
The accumulated number of reports last three months
-
The accumulated number of reporters in the last three months
-
Number of reports based on report status
-
Number of incoming reports per channel
-
Number of reports by category
-
The word that appears the most in the contents of the report
-
Comparison of the number of reports of the top 5 categories in the period of COVID-19 and before COVID-19
Food Commodity Price
Through this dashboard, you can see the development of
prices of some food commodities in traditional markets during the
COVID-19 period such as rice, beef, eggs, onions, chili, sugar, and oil.
The data presented is sourced from the National Strategic Food Price
Information Center (PIHPS) and Jakarta Food Information. Don't forget to
try to order your essentials through the online service provided by PD
Pasar Jaya, so that you can stay at home.
[Pasar Jaya Launches Online Grocery Shopping]
List of data you can see in this dashboard:
Jakarta’s Air Quality During COVID-19 Period
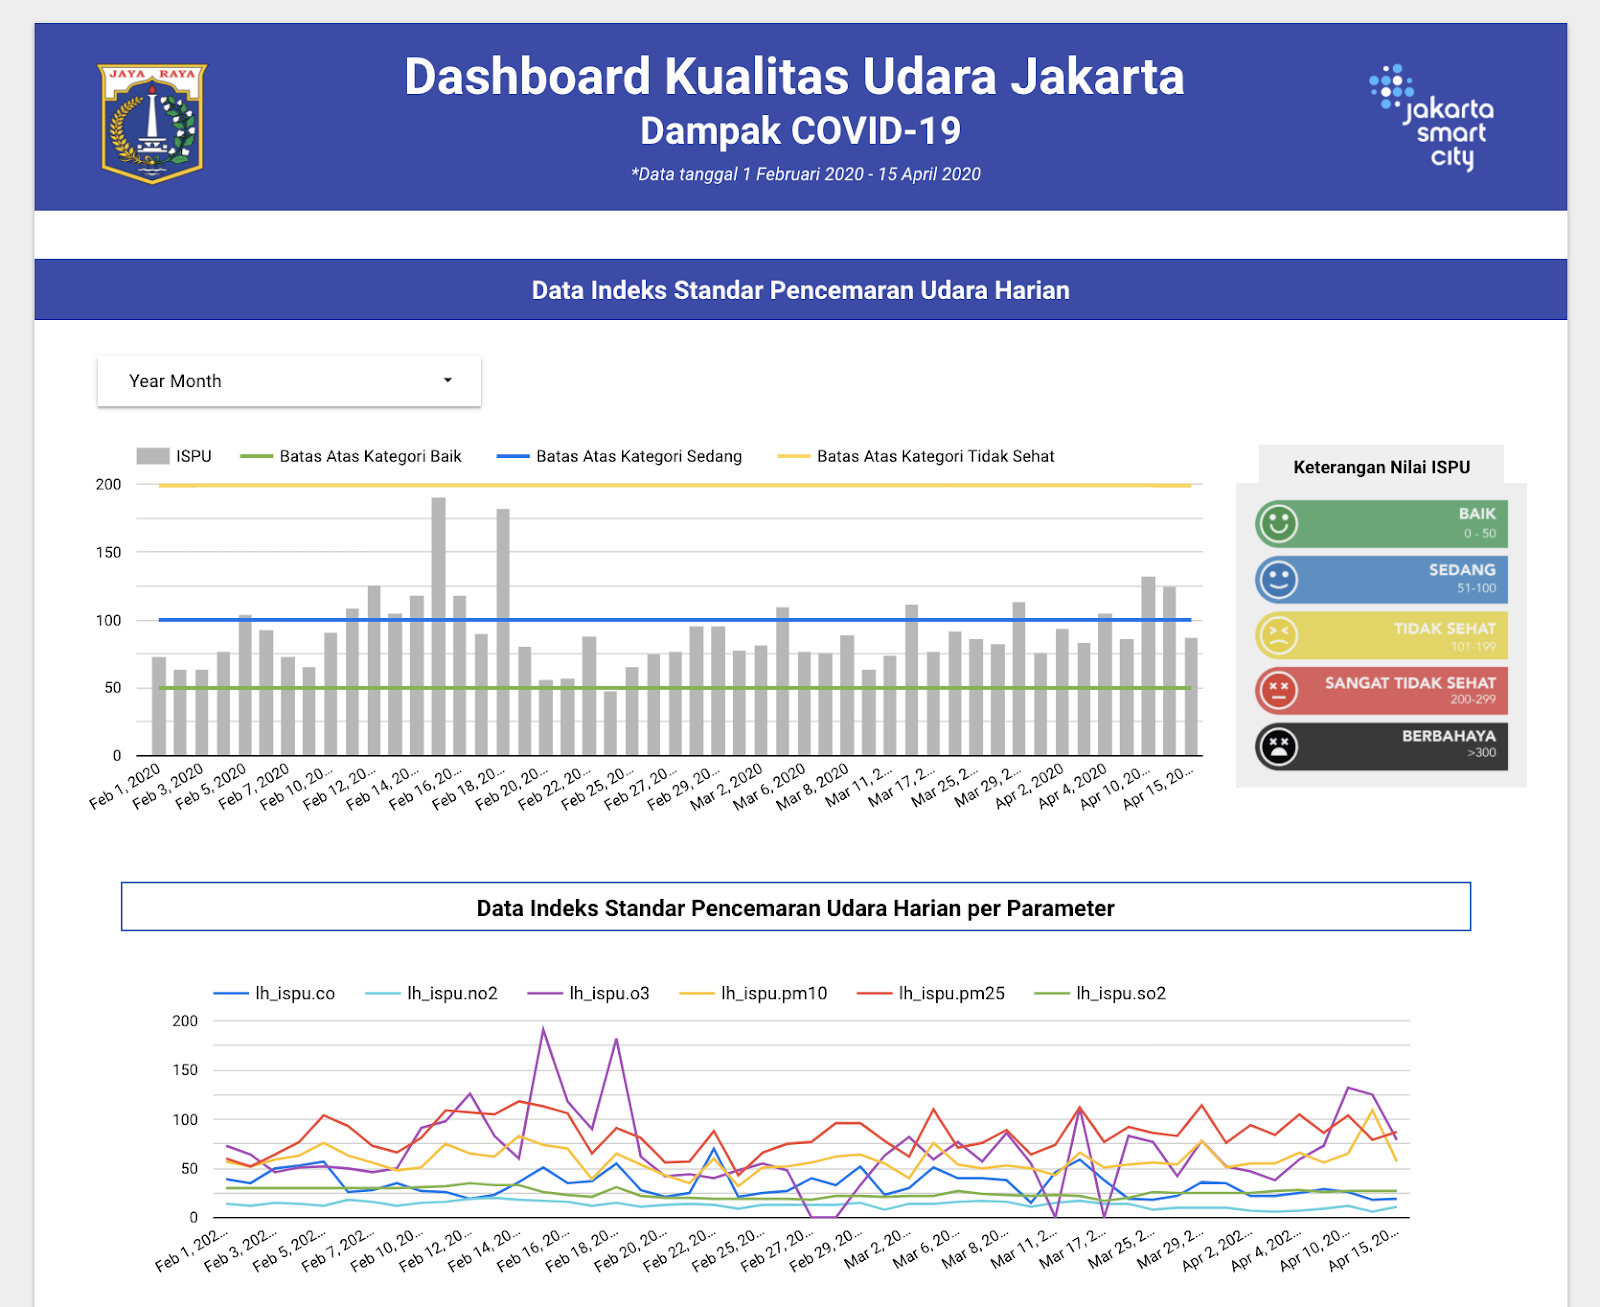
You can monitor the level of air quality in Jakarta during
COVID-19 through this dashboard. In addition to the standard air
pollution chart, there are also data on the number of days per air
quality category for several regions in Jakarta. Smartcitizen, when you
are undergoing isolation at home, you must have noticed the condition of
Jakarta's clean sky that seems to tempt us to get out. Now, use that as
a motivation to do better to the environment, so that when Jakarta is
free from the coronavirus, the blue sky can come back to our place.
[If Jakarta Has 30% Green Open Space ...]
List of data you can see in this dashboard:
-
Daily air pollution standard index data
-
Number of days by air quality category based on periods related to COVID-19
-
Number of days based on air quality categories per observation station location
-
Standard air pollution index data per month
Mudik Preparation Analysis from the Citizen's Economic & Demographic Perspectives
If previously we looked at data on the government's
preparation in anticipating mudik from a transportation perspective, now
we will see how the government assesses the impact of mudik based on
economic and demographic data from the community. From the economic
side, you will be presented with data such as the average wage of
laborers in the February-March 2020 period. While for the demographic
side, you can see the regions or provinces that become the destination
of travelers in 2019.
List of data you can see in this dashboard:
-
Travelers who have done mudik early by March 1 - 28 2020
-
Regions that receive funds from Jabodetabek travelers in 2019
-
Cash needs for travelers in 2019 in trillion units
-
Average labour wage
-
Average food prices during the fasting-Lebaran period in 2019
Economic Impacts Related to COVID-19

When the COVID-19 pandemic hit Jakarta, images started to
appear on social media, scenes that we might never have imagined before.
From empty airports deserted by tourists, to the row of closed shops in
several shopping centres. These are only a few examples of the economic
impact felt by the people of Jakarta now. The Government of Jakarta
continues to look for ways to ease the economic burden on its citizens,
one of which is by distributing social assistance packages to vulnerable
communities affected by COVID-19. Smartcitizen, this dashboard will
take you to see the effect of the coronavirus on the economy in the
capital from various sectors such as finance, tourism and tax revenue.
List of data you can see in this dashboard:
-
Monthly and annual inflation movements
-
Monthly inflation according to expenditure groups in March 2020
-
Details and average prices of food commodities in January-March 2020
-
The number and country of origin of tourists in Jakarta
-
Developments in exports and details of top commodities
-
Five export destinations in January and February 2020
-
Import Development
-
Five countries of origin of imports in January and February 2020
-
Plans and realization of tax revenue in January-March 2020
-
Details of passenger data on domestic planes and trains
-
Total marketing turnover of flowers and ornamental plants by location and type of commodity
Network Graph of the Spread of COVID-19
In measuring how severe the level of transmission of a
virus, researchers use a benchmark called R0 or R-naught. At present,
the R0 value for the virus that causes COVID-19 disease, SARS-Cov-2,
ranges from 1.4 to 5.7. This means that one person who has been infected
can, on average, transmit to one to five other people. The pandemic can
only be successfully overcome if the R0 value does not exceed 1. This
information gives us a little picture of the pattern of transmission of
COVID-19 which resulted in the emergence of several case clusters in
Jakarta, as shown in this dashboard with data provided by the Health
Office of Jakarta.

City Dashboard
Jakarta does not remain silent, Jakarta continues to
innovate and develop to realize the creation of a city that is smart and
comfortable to live in. To monitor its progress, the Government of
Jakarta relies on a dashboard that provides an overview of the condition
of the capital, from the process of following up on citizen reports,
education, to the environment. The type of data displayed is divided
into six, in accordance with the six Smart City indicators:
-
Smart Governance
-
Smart People
-
Smart Economy
-
Smart Living
-
Smart Mobility
-
Smart Environment

Not only is this a form of transparency to its citizens,
but the Data Visualization feature is also proof that the government is
always trying to handle the COVID-19 pandemic in a measurable and
certainly not arbitrary manner. So don't forget, Smartcitizen, keep in
touch with developments of coronavirus cases and mitigation processes in
corona.jakarta.go.id.
 112
112